



Coffee has occupied a familiar place in American routines for generations, and recent consumption figures suggest that little has changed.
According to the spring 2026 National Coffee Data Trends report, 66% of American adults drank coffee the previous day, making it the country’s most widely consumed beverage in the survey.
Coffee also finished ahead of:
- Bottled water at 64%
- Tea at 47%
- Soda at 46%
- Juice at 26%
Such figures might suggest that America’s coffee habit is growing stronger. Yet the longer-term evidence tells a more measured story.
Coffee consumption increased during the early 2020s, but recent surveys have shown remarkably little movement in the proportion of adults drinking it.
Meanwhile, specialty coffee, cold brew, and new preparation methods continue to attract consumers.
So, how many Americans drink coffee, and does the evidence actually point to continued growth?
How Many Americans Drink Coffee Every Day?
Approximately two in three American adults, or 66%, reported drinking coffee the previous day in the spring 2026 survey.
Looking at a slightly longer period, 73% consumed coffee during the preceding week, representing an estimated 195 million adults.
Americans also consume approximately 507 million cups of coffee daily, although that national figure is an estimate rather than a direct count.
Research conducted January 5-20, 2026, surveyed a nationally representative sample of adults aged 18 and older who had consumed a beverage other than tap water the previous day.
Importantly, past-day consumption does not necessarily mean daily consumption.
Someone who drinks coffee three times a week might have consumed it on the day preceding the survey.
Consequently, the 66% figure measures consumption during a particular reporting period, not the proportion of Americans who drink coffee every single day.
Still, consistency across repeated surveys makes the finding persuasive.
Coffee is clearly an established national habit, even if the familiar description of Americans needing their daily cup is less precise than it sounds.
Is Coffee Consumption in America Still Increasing?
Coffee consumption was nearly 7% higher in 2025 than in 2020, suggesting meaningful growth over five years.
Past-day consumption reached 67% in spring 2024, its highest reported level in two decades.
Longer-term polling offers an important qualification. Gallup found that 64% of American adults drank coffee on an average day in 2015, a proportion essentially unchanged compared with 2012 and similar to 1999.
Although Gallup’s methodology differs from the newer consumption surveys, the historical consistency is difficult to overlook. Coffee’s popularity was already firmly established decades before the recent increase in specialty beverages.
Yet subsequent results showed remarkably little movement:
- Spring 2025 – 66%
- Fall 2025 – 66%
- Spring 2026 – 66%
- Fall 2026 – 66%
September’s Fall 2026 findings therefore extended the pattern of stability rather than indicating another increase.
Much of the earlier growth also appears connected to specialty beverages.
Between 2020 and 2025, past-day specialty coffee consumption increased from 39% to 46% of adults, while traditional coffee consumption changed only slightly, from 43% to 42%.
A further increase brought specialty coffee to a record 48% of adults in the fall 2026 survey.
We would hesitate to interpret that growth as evidence of an expanding population of coffee drinkers. Existing consumers can switch between traditional and specialty preparations without changing overall participation.
Coffee’s market may be changing considerably even when the proportion of Americans drinking it barely moves.
Stability is particularly interesting when compared with changing alcohol consumption. While coffee continues attracting roughly two-thirds of American adults, fewer Americans are drinking alcohol than at any point since national polling began in 1939.
How Much Coffee Do Americans Actually Drink?
 American coffee drinkers consumed an average of 2.8 cups daily in spring 2026, compared with approximately three cups reported in 2025.
By fall 2026, that average had declined to 2.6 cups.
Older consumption research provides additional context.
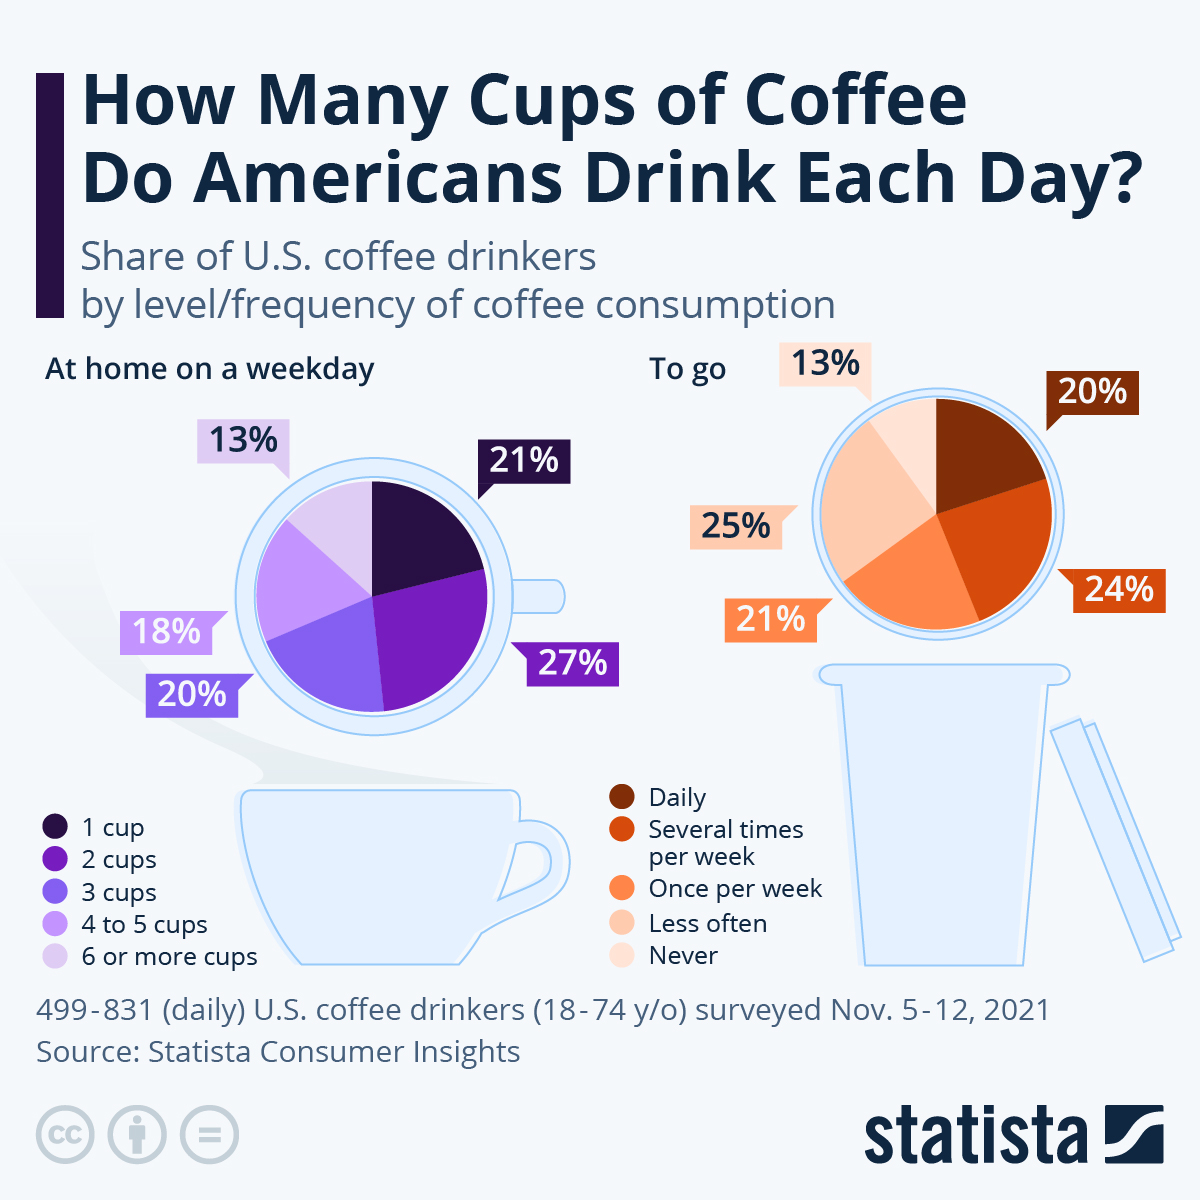
A January 2023 Statista analysis found that among Americans who drank coffee daily, nearly 80% consumed at least two cups at home on a weekday. More than half consumed three or more.
Takeaway coffee was less frequent. Approximately 20% of coffee drinkers purchased it daily, while another 24% did so several times weekly.
Those findings concern different survey populations and periods, so direct comparisons require caution.
Cup size introduces another complication. A small espresso and a large mug of drip coffee are both counted as servings in ordinary conversation, despite potentially substantial differences in volume and caffeine content.
Consider two coffee drinkers. One consumes three small cups at home, while another purchases a single large coffee each morning.
A simple cup count might suggest considerably greater consumption by the first individual, even though actual fluid volumes could tell another story.
For assessing caffeine exposure, beverage size and preparation matter more than the number of cups alone.
FDA figures place a typical 12-ounce serving of brewed coffee between 113 and 247 milligrams of caffeine.
Consequently, two people reporting the same number of daily cups may consume considerably different amounts of caffeine. Cup counts are useful for describing habits, but they are a relatively crude measure of actual intake.
Coffee vs. Other Beverages: How Does It Compare?
View this post on Instagram
Coffee led all major beverage categories in the spring 2026 survey.
| Beverage | Adults who consumed it the previous day |
| Coffee | 66% |
| Bottled water | 64% |
| Tea | 47% |
| Soda | 46% |
| Juice | 26% |
Coffee’s advantage over bottled water was just two percentage points, while its lead over tea and soda approached 20 points.
An important distinction is that these percentages measure how many adults consumed each beverage, not how much they drank.
Respondents could also report consuming several categories during the same day.
Coffee’s first-place position is credible and consistent with previous surveys.
Still, a narrow lead over bottled water hardly suggests overwhelming dominance, particularly when tap water is treated separately.
How Americans Drink Coffee Is Changing
Coffee shops may attract considerable attention, but home consumption continues to account for much of America’s coffee habit.
During spring 2026, 85% of past-day coffee drinkers reported consuming coffee at home, the highest proportion recorded since 2012. Another 36% drank coffee outside their homes, with some people doing both.
Earlier findings showed that 71% had coffee prepared exclusively at home in 2025, compared with 63% in 2020.
Among spring 2026 respondents who drank coffee at home, automatic drip machines were the leading preparation method at 37%, followed by single-cup brewers at 28%.
Specialty beverages, meanwhile, continued gaining customers.
During spring 2026:
- 58% of adults consumed specialty coffee during the preceding week.
- Weekly espresso-based consumption reached 45%, compared with 40% in 2022.
- Lattes reached 21% weekly consumption, followed closely by espresso at 20%.
- Cold brew reached 18% weekly consumption, a 31% increase compared with 2025.
Summer brought additional changes. Weekly espresso-based consumption reached 47% in fall 2026, while cold brew increased to 21%.
Out-of-home consumption also reached 38% of past-day coffee drinkers in that survey, the highest proportion recorded since January 2020.
Such movements suggest that coffee preferences are becoming more varied, even as participation stays stable.
Home preparation continues to dominate, but consumers appear increasingly willing to change the type of coffee they drink and where they purchase it.
What the Latest Coffee Statistics Really Tell Us
Coffee consumption surveys have been conducted since 1950, providing an unusually long historical record of American beverage preferences.
USDA projected global coffee consumption would reach 179.7 million 60-kilogram bags during the 2026/27 marketing year, with the United States among the markets contributing to growth.
That history helps distinguish a lasting habit from a temporary increase.
Regional differences also deserve attention. Spring 2026 figures showed considerable variation across the country.
| U.S. region | Past-day coffee consumption |
| Northeast | 75% |
| West | 68% |
| South | 66% |
| Midwest | 57% |
Northeastern adults were 18 percentage points more likely to report past-day coffee consumption than Midwestern adults.
Several limitations also matter.
Consumption figures rely on self-reported behavior, seasonal conditions can influence beverage choices, and research commissioned by an industry association deserves appropriate scrutiny.
January and June surveys, for example, may capture different preferences for hot and iced coffee.
Another distinction is especially important. Coffee consumption statistics do not establish health benefits or risks. Frequency of consumption cannot independently determine how coffee affects cardiovascular health, sleep, or other outcomes.
Coffee Remains Popular, but the Story Is More About Stability Than Growth
Approximately two-thirds of American adults continue to drink coffee on a typical surveyed day, while nearly three-quarters consume it during a given week.
Coffee consumption has increased over the longer term, but four consecutive surveys reporting 66% past-day participation suggest that recent growth in the number of drinkers has slowed considerably.
Specialty beverages, cold brew, and changing preparation habits provide evidence of an active market.
They do not, by themselves, establish that more Americans are becoming coffee drinkers.
Coffee’s position in American life appears secure. What is less certain is how much further its audience can expand.
For now, the evidence points to an established habit being expressed in increasingly different ways, rather than another major surge in popularity.