


America’s obesity rate has stopped climbing significantly in recent years. Under normal circumstances, that might sound like good news.
But there’s a problem with that interpretation.
About 40.3% of American adults have obesity, according to national health data collected between August 2021 and August 2023. Meanwhile, 9.4% have severe obesity, a condition that has become considerably more common over the past decade.
In other words, overall obesity rates may be leveling off, but the most serious category has continued growing over the longer term.
That raises an uncomfortable question. If America’s obesity problem is stabilizing, why are more people reaching the highest BMI category?
Newer weight-loss medications have also entered the conversation, promising results that traditional approaches often struggle to achieve. But effective treatments and improving national statistics are two different things.
Knowing which numbers matter is the first step toward figuring out what progress actually looks like.
How Many Americans Have Obesity?

According to the CDC’s Survey, 40.3% of U.S. adults ages 20 and older had obesity during August 2021 to August 2023.
Nearly one in ten adults, or 9.4%, had severe obesity.
Researchers use body mass index (BMI), a calculation based on height and weight, to classify these conditions.
- Overweight – BMI between 25 and 29.9.
- Obesity – BMI of 30 or higher.
- Severe obesity – BMI of 40 or higher.
People often miss an important distinction when discussing how many Americans are overweight.
According to updated national estimates published in February 2026, 32.1% of adults were in the overweight category without obesity during the 2021-2023 survey period.
Meanwhile, the percentage of Americans overweight, including those with obesity, was 72.4%.
That means nearly three out of four American adults fell into one of those two BMI categories.
Severe obesity is included within the obesity figure, so those percentages shouldn’t be added together.
BMI also has some important limitations.
Someone with considerable muscle mass can register a high BMI without having excessive body fat. Conversely, someone with a BMI below 30 may carry excess abdominal fat associated with metabolic problems.
BMI doesn’t measure fat distribution, blood pressure, cholesterol, or blood sugar.
According to the National Institutes of Health, BMI doesn’t directly measure body fat or reveal where someone stores excess fat.
That’s why a person’s BMI can tell doctors something useful without telling them everything about their health.
Severe Obesity Keeps Rising, Even as Overall Rates Level Off
Here’s where America’s obesity statistics become more concerning.
Between 2013-2014 and 2021-2023, overall adult obesity prevalence showed no statistically significant change.
Severe obesity followed a different pattern.
Age-adjusted prevalence increased significantly, climbing from 7.7% to 9.7% during that period.
Looking further back makes the change even clearer.
In 1999-2000, the age-adjusted severe obesity prevalence was approximately 4.7%. By 2021-2023, it had reached 9.7%.
That’s slightly more than double the earlier percentage, a substantial increase over roughly two decades.
A distinction matters here. Age-adjusted figures account for differences in the population’s age distribution, making comparisons across survey periods more meaningful.
Meanwhile, the commonly reported 9.4% severe obesity figure is the unadjusted estimate for 2021-2023.
Neither number is incorrect. They answer slightly different statistical questions.
Consider what these findings mean in a hypothetical group of 1,000 American adults.
| BMI category | Approximate adults |
| Obesity, including severe obesity | 403 |
| Severe obesity | 94 |
| Obesity without severe obesity | 309 |
| Below the obesity threshold | 597 |
Calculations use the unadjusted 2021-2023 national estimates, rounded to whole people.
Nearly 94 people in that group would fall into the severe obesity category.
More importantly, those 94 people face an increased likelihood of serious complications associated with excess body fat, including:
- Type 2 diabetes
- Cardiovascular disease
- High blood pressure
Greater obesity severity is generally associated with greater health risks, although individual outcomes vary.
A stable national obesity percentage doesn’t necessarily mean Americans are becoming healthier. Changes inside that percentage deserve attention, too.
Who Is Most Affected by Obesity in the U.S.?
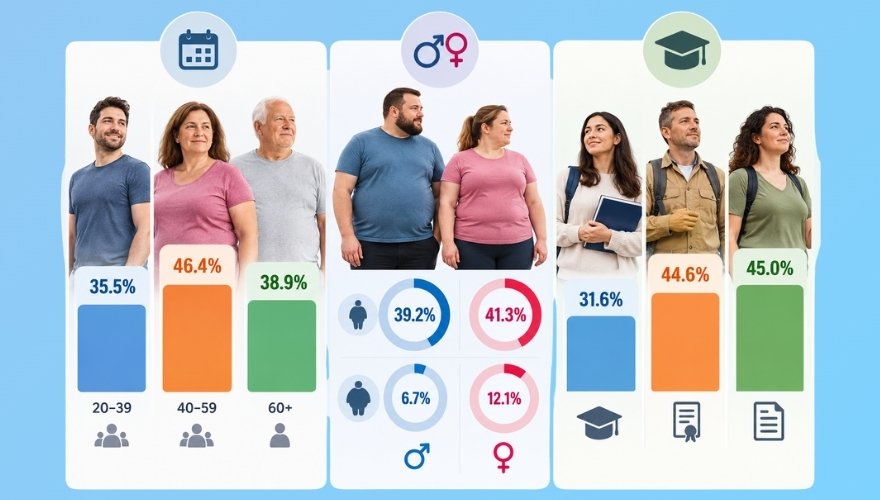
Obesity doesn’t affect every demographic group equally, and the differences are substantial enough to challenge some familiar assumptions.
Adults ages 40-59 had the highest obesity prevalence in the 2021-2023 survey.
| Age group | Obesity prevalence |
| 20–39 years | 35.5% |
| 40–59 years | 46.4% |
| 60 years and older | 38.9% |
Nearly half of middle-aged American adults had obesity.
Severe obesity also varied considerably by sex.
Among women, prevalence reached 12.1%, compared with 6.7% among men. That’s approximately 1.8 times as high.
Interestingly, overall obesity rates were much closer, at 41.3% among women and 39.2% among men. Researchers found no statistically significant difference between those overall rates.
Education showed another notable pattern.
Adults with a bachelor’s degree or higher had an obesity prevalence of 31.6%, compared with 44.6% among adults with a high school education or less and 45.0% among those with some college education.
Education itself doesn’t explain every difference. Income, neighborhood conditions, occupational demands, and healthcare access can all influence health behaviors and outcomes.
Consider two people receiving identical advice to exercise regularly and prepare nutritious meals.
One works predictable hours, lives near a grocery store, and has access to a safe walking route.
Another works rotating shifts, depends on limited transportation, and has few affordable grocery options nearby.
Both can make meaningful changes, but the practical difficulty isn’t equivalent.
Can Weight-Loss Drugs Help Reverse the Trend?
Medications such as Wegovy and Zepbound have changed expectations around medical weight management.
Both are prescription treatments that influence hormonal pathways involved in appetite regulation and food intake.
Interest in these treatments is translating into actual use. According to Gallup, 11% of American adults now take a GLP-1 drug for weight loss, up from just 3% in 2024.
That’s a substantial increase in only two years. But even with more Americans turning to these medications, it’s still too early to tell how much they’ll change national obesity rates.
While Wegovy utilizes semaglutide to target GLP-1 receptors, Zepbound relies on tirzepatide to engage both GIP and GLP-1 pathways, influencing key hormonal signals that help regulate appetite and control daily food intake.
Clinical trials have shown substantial average weight reductions among eligible participants using these medications alongside dietary and physical activity interventions.
For some patients, that’s a meaningful advance after years of struggling with approaches that produced limited or temporary results.
Still, there’s a difference between losing weight during a clinical trial and maintaining that result for years. A 2024 randomized clinical trial examining tirzepatide offers a useful example.
Participants initially lost an average of 20.9% of their body weight after 36 weeks of treatment.
During the following 52 weeks, participants who switched to a placebo regained approximately 14% of their body weight, while those continuing treatment lost an additional 5.5%, according to the SURMOUNT-4 randomized clinical trial.
That finding matters because obesity frequently requires long-term management.
Stopping medication can lead to substantial weight regain, and continued treatment may be necessary to maintain benefits.
Access creates another complication.
Cost, insurance restrictions, medication availability, eligibility requirements, and side effects can make treatment difficult to obtain or continue.
Patients also need appropriate medical evaluation. Prescription obesity medications aren’t suitable for everyone, and treatment decisions should account for medical history, contraindications, and individual health goals.
Could these treatments eventually reduce America’s obesity prevalence?
Possibly.
However, the national 2021-2023 survey can’t establish their population-level impact. Widespread use of newer medications occurred too late to be fully captured by that survey period.
Clinical success is encouraging, but claiming that these drugs have already reversed America’s obesity problem would go further than the evidence supports.
What Do These Numbers Actually Mean for Americans?
Obesity statistics are useful for tracking population health, but they can also encourage an overly narrow conversation about weight.
Someone’s BMI doesn’t automatically reveal their metabolic health, physical fitness, or future medical outcomes.
Excess body fat, particularly around internal organs, can contribute to inflammation, insulin resistance, and cardiovascular problems. Still, clinical risk depends on several factors, including age, genetics, fat distribution, and existing medical conditions.
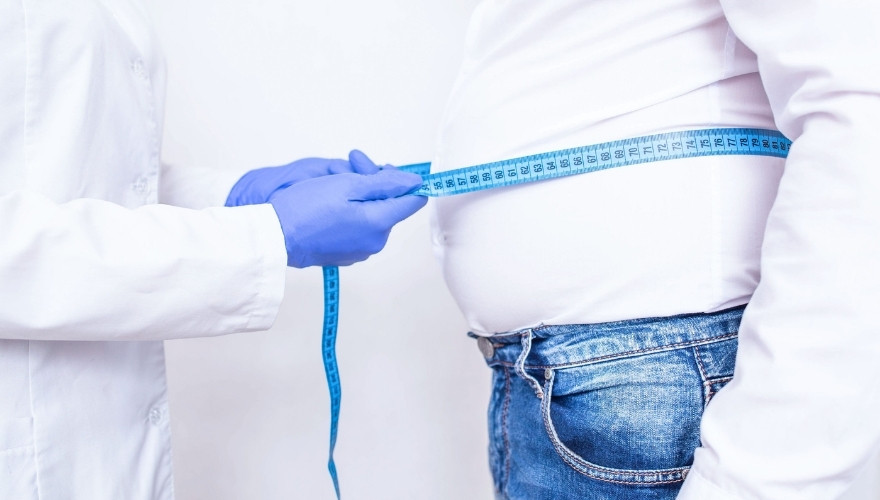
A more useful medical conversation includes blood pressure, blood sugar, cholesterol, waist measurements, and other relevant clinical findings.
Obesity treatment shouldn’t focus exclusively on reaching a particular number on the scale.
Watch the video below to learn more about the factors contributing to obesity and the importance of prevention.
Practical prevention also requires more than repeating familiar advice.
Eating nutritious food and maintaining regular physical activity are important.
But access to affordable groceries, effective medical care, sufficient sleep, and sustainable treatment options can determine how realistic those recommendations are.
Physical activity also presents an interesting generational contradiction.
As I discussed in my piece on retirees outwalking Gen Z, younger adults aren’t automatically the most active generation. Age alone tells us surprisingly little about someone’s everyday movement habits.
The Obesity Problem Is Changing, Not Disappearing
America’s obesity rate may have stopped increasing significantly in recent years, but that doesn’t mean the country has turned a corner.
Severe obesity has become considerably more common over the longer term, even as the overall prevalence has shown signs of stabilization.
Newer medications offer meaningful treatment possibilities. Better prevention, affordable healthcare, and sustained support could also improve outcomes for millions of Americans.
Still, a lower obesity percentage shouldn’t be the only measure of success.
Fewer cases of type 2 diabetes, cardiovascular complications, and obesity-related disability would tell a more meaningful story about public health.
After all, the goal is to improve America’s health. Changing a statistic is only one way to measure it.